What technological tool is employed to visualize and track the known spatial spread of the ant?
Answer
Geographic Information Systems (GIS)
To effectively manage and monitor the dispersal patterns of the Yellow Crazy Ant across large or complex landscapes, Geographic Information Systems, commonly abbreviated as GIS, are frequently utilized. GIS technology allows biosecurity teams to visualize spatial data sets that depict confirmed detections of the ants. By mapping these clusters, agencies gain crucial insights into the infestation pattern, such as identifying radiation outward from initial introduction points. This crucial mapping capability enables the precise and effective allocation of limited pest control resources exactly where the confirmed presence dictates.
Related Questions
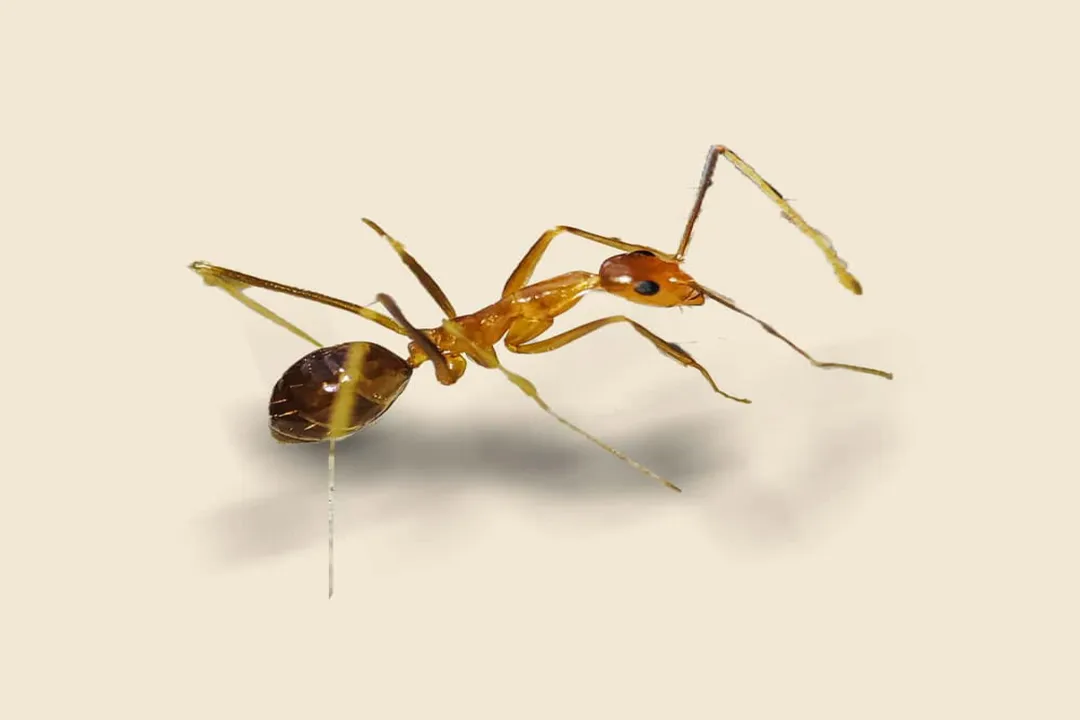
What are the native origins of the Yellow Crazy Ant, *Anoplolepis gracilipes*?What is the primary management strategy in Queensland's Wet Tropics region?How does the operational response in NSW contrast with the Wet Tropics strategy?What specific human infrastructure is frequently nested in by Yellow Crazy Ants?What technological tool is employed to visualize and track the known spatial spread of the ant?What food source do Yellow Crazy Ants frequently 'farm' near their outdoor nests?What hazard can result from large numbers of Yellow Crazy Ants swarming electrical equipment?Which vector is most associated with the introduction of ants via landscaping materials?What is the key difference in ant structure between the core infestation and the 'edge'?How is the Yellow Crazy Ant treated under Queensland legislation regarding its movement?What characteristic explains the Yellow Crazy Ant's success in tropical and subtropical zones?Where do surveillance programs in New South Wales focus their early detection efforts?